
13F Filings of Top Investors: How to Read Buffett, Klarman, Burry and More Without Losing a Weekend
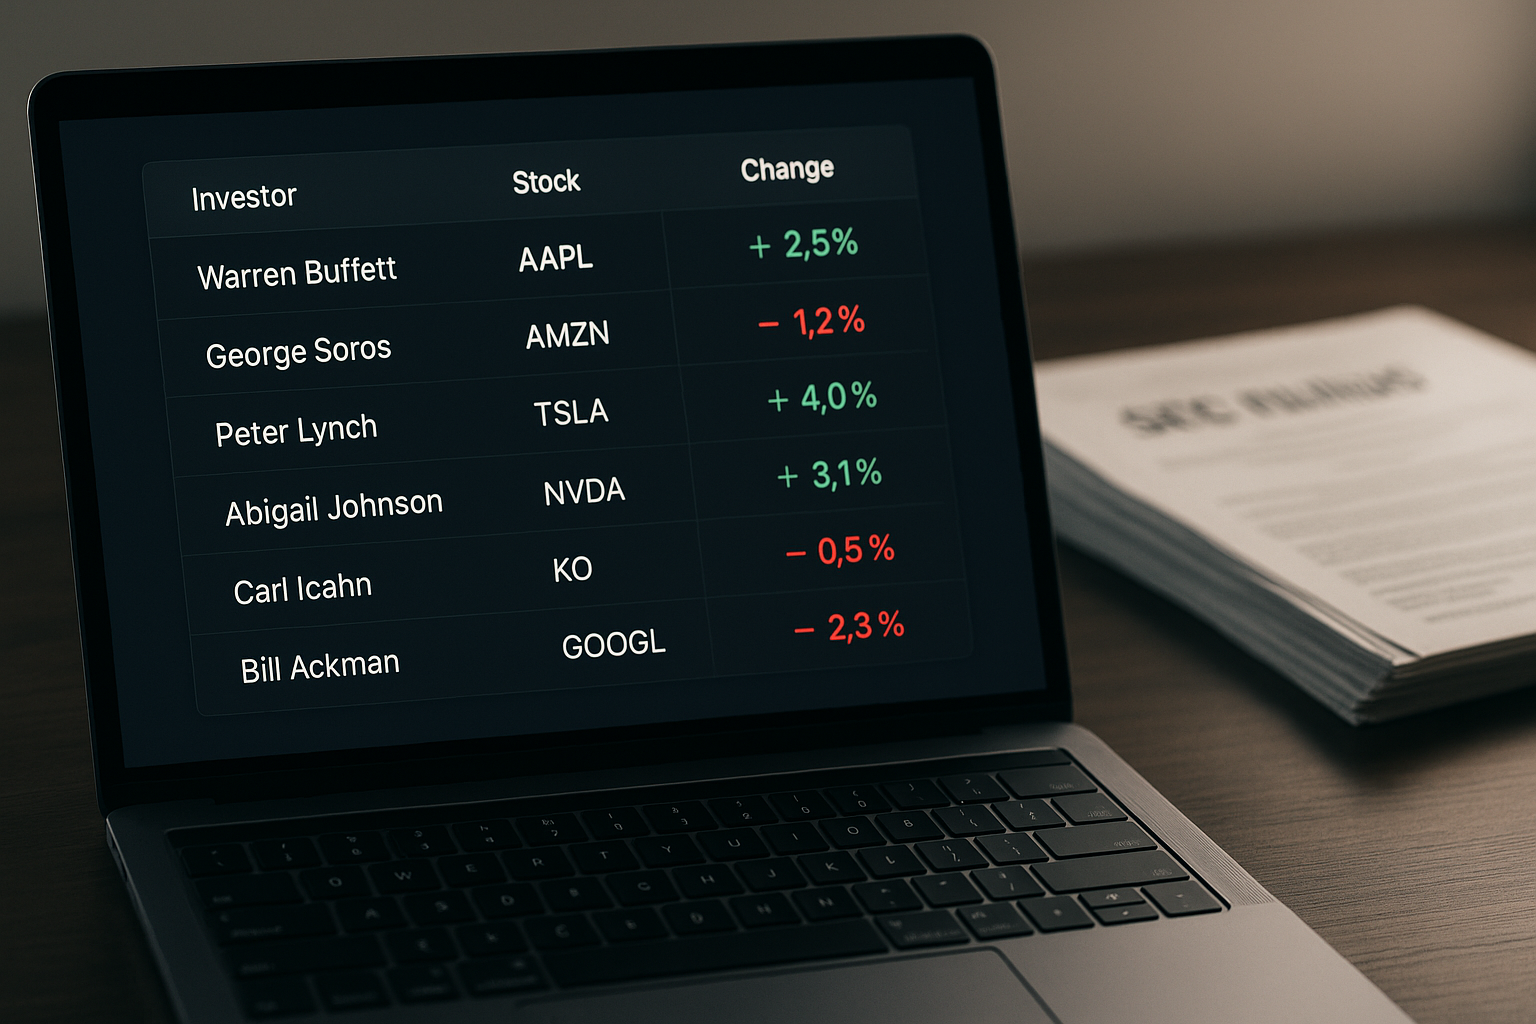
Every quarter, the SEC publishes a stack of filings that quietly reveals what some of the best investors in the world are betting on. They're called 13Fs, and if you've ever tried to read them directly on EDGAR, you know the experience is somewhere between a tax form and a phone book.
That's a shame, because the information inside is genuinely useful. The 13F filings of top investors — Warren Buffett, Seth Klarman, Michael Burry, Charlie Munger, and dozens of others — aren't just historical trivia. They're a real-time (well, quarterly) window into how disciplined capital allocators think about position sizing, conviction, and risk.
The trick is knowing what to look for, and not spending your Saturday cross-referencing 49 separate filers on the SEC website.
What a 13F Actually Tells You
A 13F is a quarterly disclosure that institutional investment managers with more than $100 million in assets must file with the SEC. It lists their U.S. equity holdings as of the end of the quarter: which stocks, how many shares, and (implicitly, once you do the math) how much conviction each position represents relative to the rest of the portfolio.
What it doesn't tell you is why. There's no commentary, no thesis, no explanation for why a fund added to a position or exited entirely. That context has to come from you — which is exactly why comparing filings across investors and across time matters more than staring at a single quarter in isolation.
The Four Things Worth Tracking
When you're going through the 13F filings of top investors, four data points do most of the work:
- Shares held. The raw position size, useful mostly as a baseline for comparison over time.
- Position value in dollars. This tells you the current market value of the stake, which matters more than share count alone since prices move independently of share changes.
- Percentage of portfolio. A $50 million stake means something very different to a $200 million fund than it does to a $50 billion one. Portfolio weight is the real signal of conviction.
- Change status. New, Added, Reduced, or Sold Out. This is often the most actionable data point — a fresh addition from a concentrated, patient investor tends to carry more weight than a stock that's been sitting untouched for two years.
None of these numbers matter much in isolation. It's the combination — a large, newly initiated position that represents a meaningful chunk of a concentrated portfolio — that tends to be worth a closer look.
Why Checking One Investor at a Time Doesn't Scale
Here's the practical problem: there isn't just one investor worth watching. Buffett's Berkshire portfolio is famous for a reason, but Klarman's Baupost Group runs a very different, more value-and-catalyst-driven book. Burry's Scion filings get attention because his bets tend to be concentrated and contrarian. Munger, when he filed separately, offered a window into a smaller, even more concentrated set of convictions.
If you want a broad view of what "smart money" is doing, you're not checking one filer — you're checking dozens. Doing that manually means dozens of separate SEC searches, dozens of PDFs, and manual math to figure out portfolio weight and quarter-over-quarter changes. It's the kind of research that institutional desks have analysts for, and individual investors typically don't.
Where Compounder Fits In
This is exactly the gap the Legends tab on Compounder is built for. On any stock's detail page, Pro subscribers can pull up a table of legendary investors who currently hold that stock — Buffett, Munger, and others — with each row showing:
- Investor name, clickable through to their full portfolio
- Shares held
- Position value in dollars
- Percentage of that investor's total portfolio
- Change status: New, Added, Reduced, Sold Out, or unchanged
Instead of hunting down which legendary investors own a stock you're researching, you see it laid out on the stock's own page. And instead of opening 49 separate filings to see what a specific investor is doing across their whole book, clicking through to their name gives you their full portfolio in one place.
Pairing 13Fs With Corporate Events
13F data gets more useful when you can see it next to what's actually happening at the company. That's where the Filings tab on a stock's detail page comes in — it surfaces significant corporate events pulled from SEC 8-K filings: spin-offs, CEO or CFO changes, dividend cuts, going-private announcements, activist investor responses, guidance changes, and restatements. Each event shows up as a color-coded card with the filing date and a direct quote from the source document.
So if you notice a legendary investor added to a position last quarter, checking the Filings tab can quickly tell you whether that coincided with a leadership change, a guidance cut, or an activist campaign — context that a bare 13F table will never give you on its own.
Following More Than the Household Names
Buffett, Klarman, and Burry get the headlines, but plenty of value in 13F data comes from watching investors and portfolios you build a habit of following over time — not just the three or four names everyone already knows. On Compounder, every investor (including individual users building and sharing their own portfolios) has a public profile page, with a stat badge for experience level, risk tolerance, and time horizon. That context matters: an "Aggressive, Short-term" trader's new position means something different than the same stock showing up in a "Conservative, Long-term" portfolio.
The Bottom Line
The 13F filings of top investors are one of the few genuinely free, genuinely useful pieces of institutional research available to individual investors. The barrier has never been access — it's been the time cost of digging through dozens of filings by hand. Tools that surface shares held, dollar value, portfolio weight, and change status side by side, next to the corporate events that might explain them, turn a quarterly chore into a five-minute scan for new ideas.