
Compounder Score vs. F-Score vs. Z-Score: Which to Trust for Quality Investing
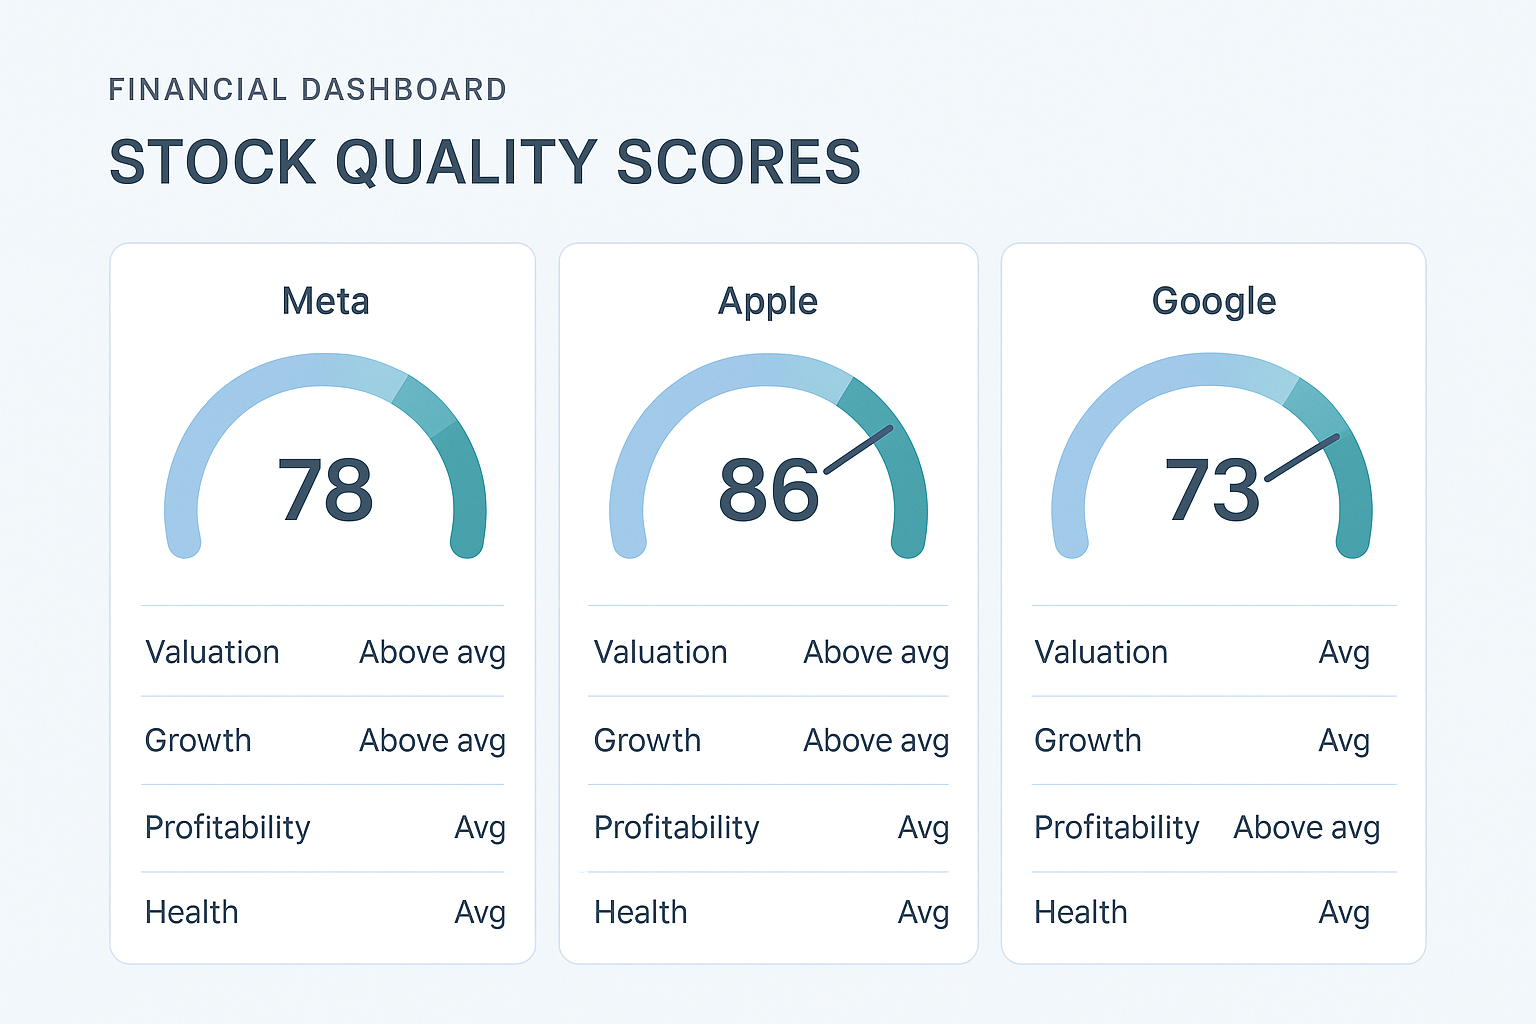
Quality investing sounds simple in theory: buy good businesses at fair prices, then let time do the work. The hard part is defining "good." Over the decades, different corners of finance have built scoring systems to answer that question — and three of the most widely referenced are the Compounder Score, the Piotroski F-Score, and the Altman Z-Score.
They all spit out a number. They all get lumped together as "quality checks." But they're not measuring the same thing, and treating them as interchangeable is where a lot of investors get tripped up.
Three Scores, Three Different Questions
The fastest way to understand these tools is to know what question each one is actually trying to answer:
- Compounder Score asks: Is this a quality compounder at a fair price?
- Piotroski F-Score asks: Are fundamentals improving year-over-year?
- Altman Z-Score asks: How likely is bankruptcy in the next two years?
That's it. That's the whole reason confusion happens — an investor pulls up a stock, sees three scores that seem to disagree, and assumes one of them must be "wrong." More often, they're just answering different questions at the same time.
What the Compounder Score Actually Measures
The Compounder Score is a 0–100 quality rating built specifically for retail value investors who want a transparent, business-quality read — not a black box. It breaks down into five equal components, each worth up to 20 points:
- Profitability — measured through Return on Equity and net margins, this component asks whether the business actually generates strong returns on the capital it's given.
- Capital structure — measured through Debt-to-Equity, this looks at leverage and whether the balance sheet is built on a stable foundation or a fragile one.
- Cash quality — measured through Free Cash Flow margin, this checks whether reported profits are backed by real cash generation, not just accounting earnings.
- Valuation — measured through earnings yield, this is the component most scores skip entirely: is the stock actually priced reasonably relative to what it earns?
- Stability — this looks at consistency over time, rewarding businesses that produce steady results rather than boom-bust cycles.
Because valuation is baked directly into the score, a great business trading at a nosebleed price won't automatically max out. That's a deliberate design choice — the Compounder Score isn't just asking "is this a good business," it's asking "is this a good business worth buying right now."
What the Piotroski F-Score Measures
The F-Score, developed by accounting professor Joseph Piotroski, is a point-based checklist that scores a company across roughly nine yes/no financial criteria spanning profitability, leverage and liquidity, and operating efficiency. Each criterion that shows improvement year-over-year earns a point.
The F-Score's strength is momentum detection. It's excellent at flagging companies whose fundamentals are trending in the right direction — improving margins, shrinking debt, better efficiency — which makes it popular among value investors screening for cheap stocks that are turning a corner.
Its blind spot: the F-Score says nothing about valuation and nothing about long-term business quality. A cyclical company can score well simply because it's recovering from a rough prior year, even if the underlying business is mediocre.
What the Altman Z-Score Measures
The Z-Score, built by Edward Altman, combines weighted financial ratios — covering working capital, retained earnings, operating earnings, market value, and sales, all relative to total assets — into a single number that estimates bankruptcy risk over roughly a two-year horizon.
This is a solvency test, not a quality test. A company can have a perfectly safe Z-Score while still being a mediocre investment — think a boring, debt-light business with flat growth and poor returns on capital. Conversely, a fast-growing company can occasionally show a shakier Z-Score simply because it's reinvesting aggressively, not because it's in danger.
Where Each Score Falls Short
No single score tells the whole story:
- The Compounder Score is built for equity quality and valuation, not distress prediction. It's not designed to answer "will this company go bankrupt."
- The F-Score ignores price entirely. A stock can improve on every F-Score criterion and still be dangerously overvalued.
- The Z-Score ignores profitability quality and valuation altogether. It only asks whether the company will survive — not whether it's a good business at a good price.
This is exactly why Compounder displays all three side by side on its Score Comparison page, rather than picking a favorite. A detailed, mobile-friendly comparison table lays out how each score is built and what it answers, so you can see at a glance where the systems agree — and, just as importantly, where they diverge.
When to Lean on Which Score
A practical way to use all three together:
- Use the Z-Score first, as a survival filter. If a company's solvency looks shaky, it may not be worth spending time on regardless of what the other scores say.
- Use the F-Score to spot improving trends, especially in beaten-down or turnaround names where momentum matters.
- Use the Compounder Score to answer the question that actually determines long-term returns: is this a high-quality business, and am I paying a fair price for it?
On a stock's detail page in Compounder, the Score tab is the default view for exactly this reason. It shows the Compounder Score broken into its five 20-point components — Profitability, Capital structure, Cash quality, Valuation, and Stability — so you can see not just the final number, but why a company scored the way it did.
The Bottom Line
Quality investing isn't about finding the one "correct" score. It's about understanding what each tool measures and using them together to fill in each other's blind spots. The F-Score tells you if things are getting better. The Z-Score tells you if the company will still be around. The Compounder Score tells you if it's a good business worth owning at today's price.
Used individually, each score gives you a partial picture. Used together — and compared side by side — they give quality investors something closer to the full one.