
Finviz Screener Limits: What It Can't Tell You About Quality
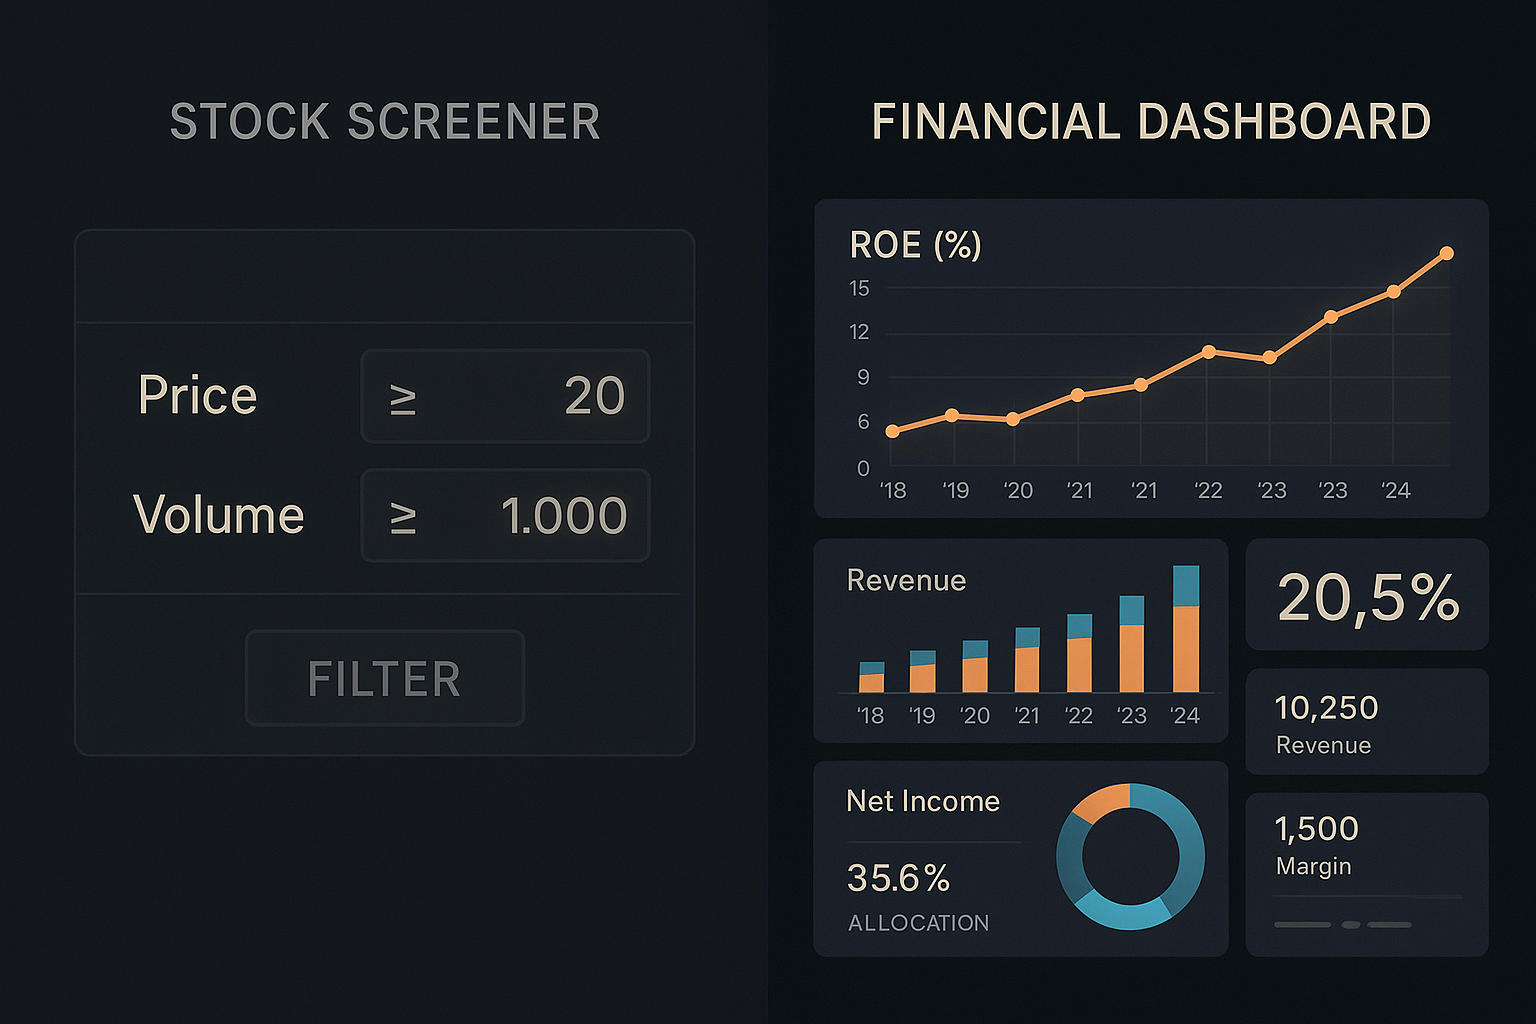
If you've spent any time screening stocks, you've probably used Finviz. It's fast, free, and covers the basics: price, volume, market cap, moving averages, and a long list of technical and single-period fundamental filters. For a lot of trading setups, that's exactly what you need.
But if you're trying to find genuinely good businesses—not just stocks that are cheap or moving—the Finviz screener starts to show its limits fast. It's built to filter a snapshot in time. It's not built to tell you whether a company has actually been a quality compounder for years.
Here's where it holds up, where it doesn't, and what to look at instead.
What the Finviz Screener Does Well
Finviz earns its popularity honestly. It's genuinely useful for:
- Price and volume filters — narrowing down by 52-week highs/lows, average volume, relative volume, and gap percentage
- Technical setups — moving average crossovers, RSI levels, chart patterns
- Basic fundamental ratios — P/E, P/B, dividend yield, and similar metrics pulled from the most recent reporting period
- Sector and industry filtering — a quick way to narrow a universe of thousands down to a manageable list
If you're looking for stocks near a breakout, screening for a specific yield range, or scanning for unusual volume, the Finviz screener does the job quickly and without cost. There's a reason it's a starting point for so many retail traders.
Where It Falls Short: Business Quality
The problem shows up the moment you ask a slightly harder question: Is this actually a good business, or does it just look cheap or hot right now?
A single-period P/E or P/B ratio can't answer that. A stock can screen as "cheap" because it's a great business temporarily out of favor, or because it's a mediocre business correctly priced for its mediocrity. Finviz's filters, built around one snapshot in time, can't tell the two apart.
Specifically, a standard price/technical screener like Finviz has no easy way to show you:
- Multi-year ROE consistency. A company posting 20% ROE this year means very little on its own. A company posting 15%+ ROE for six straight years tells you something real about the durability of its economics. Finviz filters on current or trailing figures—it doesn't surface the streak.
- Composite quality scoring. Metrics like return on equity, debt levels, earnings consistency, and capital allocation history all matter individually, but they matter more together. A single ratio filter can't combine them into one signal you can rank a universe against.
- Trend, not just level. Is margin expanding or contracting? Is debt being paid down or piling up? A snapshot filter shows you where a number sits today, not the direction it's been heading.
None of this is a knock on Finviz for what it is. It's a screener built around price action and point-in-time fundamentals. Quality investing asks a different question, and it needs a different tool to answer it.
What "Quality" Actually Looks Like in Practice
Quality-focused investors—the Buffett-style, business-first crowd—tend to care about a handful of things that don't show up in a standard screener:
- Sustained high returns on capital, not a single good year
- Low or manageable debt relative to earnings power
- Consistent earnings growth, without relying on one-time gains
- Sensible capital allocation—reinvestment, buybacks, or dividends that make sense given the business
Evaluating all four requires looking across years of financial history, not one filtered table. That's a research workflow, not a filter dropdown.
How Compounder Fills the Gap
This is the exact gap Compounder is built to close. Instead of filtering a single snapshot, Compounder's Browse & Filter Stock Universe page lets you work across the full covered universe of companies with ingested financial data—filtering by ticker, company name, sector, and market cap band (mega, large, mid, and beyond)—while the underlying data already accounts for the multi-year history that a price screener skips.
Once you've found companies worth digging into, quality scoring frameworks do the heavy lifting that a single ratio can't: rolling up return consistency, balance sheet strength, and other business-quality signals into a composite view, rather than leaving you to eyeball six different ratios and guess how they fit together.
And because research doesn't stop at finding a candidate, Compounder's Stock Strategy Backtester lets you actually test an idea instead of just screening for it. You can configure a historical test—choosing a strategy type (Compounder Score top N%, Buffett-style quality scoring above 70, or Graham net-net undervalued), a date range of at least 90 days, and a rebalance frequency of monthly, quarterly, or yearly—to see how a quality-based approach would have actually performed, rather than trusting a filter result on faith.
When you spot something worth tracking along the way—a stock, a sector, or a theme—the + Follow button on any card adds it straight to your Following list. No need to leave what you're doing to go build a watchlist somewhere else.
The Bottom Line
The Finviz screener is a solid tool for what it's designed to do: fast, free filtering on price, technicals, and single-period fundamentals. But "cheap right now" and "good business over time" are two different questions, and a stock screener built around today's numbers can't answer the second one.
If you're screening for setups and momentum, Finviz still earns its spot in the toolkit. If you're trying to separate durable quality from a good-looking snapshot, you need a workflow that looks across years, scores quality as a composite, and lets you test the results—not just filter for them.